A plot inventory is a set of numbers someone will argue with. The yield reviewer wants to know why standing volume moved. The arborist's tree protection zone gets challenged by the developer's engineer. Both arguments come back to diameter at breast height. Handheld scanners have been sold into that measurement for about a decade, mostly on the promise that covering the plot once replaces a tape on every stem. The promise is broadly true. How true, on which trees, and with what error, is what the sales pages leave out. This post is that detail, taken from the studies rather than from us.
What the plot has to produce
Australian plot inventory runs on a familiar set of numbers: stems per hectare, basal area, standing volume and the change since the last measure. Breast height in Australian forestry is 1.3 metres above ground on the uphill side of the tree. That is the ANU and Forestry Australia convention. Arboriculture here and in New Zealand uses 1.4 metres. That difference matters later.
The DAFF tree measurement manual sizes plots by stocking: about 0.2 hectares at 100 stems per hectare, down to 0.02 hectares at 1,000 or more. Rectangular where rows are visible. Centre pegged so the plot can be found again. Basal area in a fully stocked Australian stand typically sits between 20 and 50 square metres per hectare. A young or thinned stand is nearer 10 to 20. Stand volume is basal area times mean top height times a form factor. Permanent plots exist because growth is the number the whole exercise tracks.
The scanner has to meet that standard. Find nearly every stem above the minimum diameter. Get the diameter within a centimetre or two. Put the stem where the next crew can find it. Do it again next season on the same plot.
What handheld scanners measure, and how well
There is a decent body of peer-reviewed work on handheld scanners in forest plots. Almost all of it is on GeoSLAM ZEB units, Emesent Hovermap or Chinese SLAM scanners of the same class. The results are consistent enough to plan around.
On diameter, the earliest ZEB1 study (Bauwens and colleagues, 2016, Belgian and French temperate plots) found a bias of minus 0.08 centimetres and an RMSE of 1.11 centimetres against tape, for trees with complete cross-sections. The handheld fully captured 91 per cent of stems over 10 centimetres at breast height. A multi-scan terrestrial scanner managed 42 per cent, because the operator can circle the occlusions.
The largest single study is Gollob and colleagues in 2020: 20 Austrian plots of 20 metre radius, averaging 615 stems per hectare. ZEB Horizon DBH RMSE sat at 2.32 centimetres (12 per cent), with a bias of plus 0.21 centimetres. Detection was 96 per cent of stems at or above 5 centimetres DBH, and 98.8 per cent at or above 10 centimetres. About eleven minutes of scanning per plot, roughly five times faster than a terrestrial scanner.
The number closest to home is a 2025 radiata pine study in Western Australia. Hovermap clouds from 40 circular plots of 11.28 metre radius (0.04 hectares), at 100 to 1,250 stems per hectare, were processed with FoSEM. That is a processing method, not a scanner-native figure. Against diameter tape and Vertex heights, FoSEM reported DBH RMSE of 1.19 centimetres (4.7 per cent) and height RMSE of 1.00 metre (4.2 per cent). Fifteen trees were felled for stem-profile measurements. The paper uses three of those for the detailed model metrics.
Height is where the numbers spread out. Under an open pine canopy the radiata study got to a metre. In deciduous and mixed stands the scanner cannot see the apex through the crown. Height RMSE goes above 2 metres in leaf-on conditions in more than one study. A backpack unit in Slovakia consistently underestimated by half a metre to a metre and a half. Our eucalypts have no leaf-off season. Treat handheld height in native or hardwood stands as a check figure, not the reference.
Stem position from the SLAM trajectory alone lands at around 0.2 to 0.3 metres RMSE in the Slovak and Austrian work, and under 0.5 metres in a dense Mediterranean marteloscope. That is fine for finding a stem again, and for stems per hectare. It is not a coordinate you would put in a cadastral or engineering context.
Why the cloud's relative accuracy is not the diameter error
A clean SLAM cloud from a modern handheld can be internally consistent to a centimetre or better. That is the number on spec sheets. The diameter you fit to that cloud has its own error. Three things drive it.
Point density on the stem is the first. A 2025 study (Italian group, ZEB Horizon clouds from plots in southern Finland, plus a second GeoSLAM set) varied density. DBH RMSE sat above 20 centimetres below 200 points per cubic metre, under 2 centimetres between 600 and 700, and under a centimetre only at 1,000 or more. Height RMSE dropped from 2.7 metres at the sparsest setting to 0.18 metres at full density. A fast pass past a stem does not put a thousand points per cubic metre on it.
Noise shape is the second. SLAM noise on a stem is not symmetric. Points cluster inward of the true bark, so a symmetric circle fit underestimates the diameter by roughly 0.8 to 0.9 centimetres unless the fitting is skewed to match. That is why one study reports a small positive bias and another reports a 1.6 centimetre underestimate on old oaks: different bark, different fitting.
Occlusion and stem form are the third. Lower stems in spruce and pine are hidden by branches and needles. Forks and buttresses at breast height break the circle assumption. Thin stems under 5 centimetres, and clustered regeneration at 1,000 to 2,000 stems per hectare, are where detection falls away in the boreal work. Conifer plots come out worse than broadleaf for both position and diameter in most of the comparisons.
How 3DFin gets from a cloud to a tree list
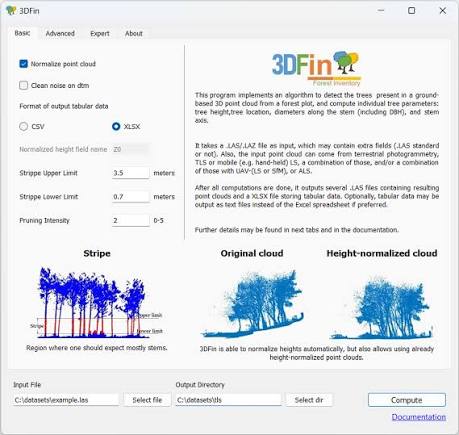
3DFin is the free CloudCompare plugin from Cabo and colleagues, published in Forestry in 2024. It is also a QGIS plugin and a standalone Windows app. We run it on the first plot because its method is documented and its validation is public.
It takes a LAS or LAZ cloud, optionally denoises it, and builds a ground model with the cloth simulation filter. Then it subtracts that model so every point has a height above ground. A bad ground model wrecks the diameters. Look at the ground on a steep or cluttered floor before anything else.
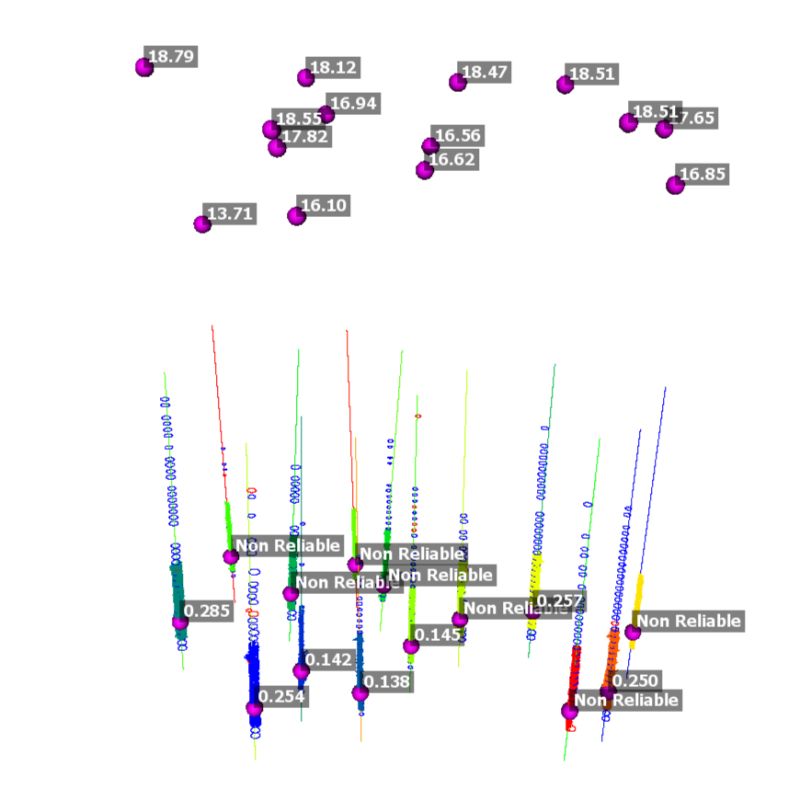
It then looks for vertical stem segments in a stripe of the lower stand, clusters them, and peels stems off one at a time. On each stem it fits circles to horizontal slices at evenly spaced heights, so you get diameters along the bole, not just at 1.3 metres. Tree height comes from voxelising the cloud, clustering it and taking the highest voxel near the stem axis.
Every fitted circle is then tested four ways: how many points fall inside the circle where there should be none, how many of sixteen angular sectors are occupied, whether the diameter sits in the expected range, and whether the section is tilted beyond what a stem should be. A stem whose circles near breast height fail those checks is flagged. The diameter is still written out. A flag is an instruction to open the cloud, not a missing value.
On the validation plots (four 25 metre radius plots in the Vienna Woods, scanned by terrestrial, handheld and photogrammetric methods) the paper reports DBH RMSE under 2 centimetres and bias under 1 centimetre in most scenarios, near-complete detection, and two to seven minutes of processing per plot.
One detail for Australian users: 3DFin fits DBH at 1.3 metres by default, which matches forestry practice here. For an arboricultural survey to AS 4970 you want the diameter at 1.4 metres. The section-height settings need to say so.
Georeferencing: RTK does not work under canopy
This is the claim most often overstated. A scanner with a built-in RTK receiver can put an open-sky capture on real-world coordinates to a few centimetres. Inside a stand it cannot.
A 2024 study with a four-constellation survey receiver under pine and beech-oak canopy in Romania obtained no fixed solutions at all across 2,670 epochs. 97 per cent were differential-only. Horizontal RMSE sat at 2.03 metres, worse under conifer (2.47 metres) than deciduous (1.84 metres). The receiver was left one to two hours without ever resolving ambiguities. GNSS-aided mobile mapping under canopy shows the same problem from the other side: outages up to 87 seconds, dozens per cloud and misaligned copies of the scene.
So the honest options for putting a plot on a datum are the ones the studies themselves used. Start and finish at a feature-rich point in the open where the receiver holds a fixed solution, and let the SLAM trajectory carry the coordinates in. Peg the plot centre and occupy it with a static receiver, or tie it in with a total station from an open-sky control point. Place four targets per plot and shoot them, which is how the Slovak comparison got its reference positions. Or accept that a remeasure plot is a relative model on a pegged centre, and register each season's cloud onto the last one on the stems themselves. For most plantation networks the fourth option is enough. The question is which stems grew, died or were removed, not where they sit in MGA2020.
On remeasure, yearly diameter increment on a single stem sits inside the 1 to 2 centimetre DBH RMSE the handheld studies already report. What repeat scans do reliably is count, detect and locate. Growth still wants the plot-level aggregate.
Capture practice that the numbers depend on
The plot patterns with measured results are simple. Gollob's crews covered the plot perimeter and two crossing traverses, closing the loop at the plot centre, in about eleven minutes for a 20 metre radius plot. In the Spanish marteloscope, a track 50 per cent longer lifted detection above 90 per cent and pulled position error under half a metre. The urban campus study in China capped each plot at 30 minutes.
Pace slowly enough to put density on the stems, on the order of 0.5 to 1 metre per second. Circle the stems whose diameter you will be asked to defend, rather than passing them on a straight line. Scan in still air if you can. Wind moves foliage and thin stems between passes, and the SLAM solution smears them.
Leaf-off is useful in a poplar or oak plot and irrelevant in a eucalypt one. In the Slovakia backpack study (Betula and Populus in Tatra National Park, LiBackpack DGC-50, felled-tree reference) height RMSE sat at 0.93 to 0.97 metres leaf-off and 1.91 to 1.92 metres leaf-on on both plots. DBH was more mixed. Betula stayed nearer 2 centimetres. On the Populus plot the RMSE nearly tripled leaf-on.
Urban trees: a different standard and a different height
The urban survey is a different report. AS 4970-2009 defines the tree protection zone as twelve times the trunk diameter measured at 1.4 metres above ground, not less than 2 metres and not more than 15 metres in radius unless crown protection requires it. The structural root zone comes from a formula on the diameter above the root buttress, with a 1.5 metre minimum for small trees. Encroachment of less than 10 per cent of the TPZ area outside the SRZ generally needs no root investigation. So the diameter drives a design decision, not just a table.
A council arborist report template (Waverley's is typical) wants, per tree: common and scientific name, height, age class, canopy spread, trunk diameter and number of trunks, condition and structure, hazard, useful life expectancy and the TPZ and SRZ to AS 4970. A handheld cloud gives you diameter at any height you choose, including 1.4 metres and above the buttress, height to a metre or so, crown spread as a measured extent rather than an eye estimate and stem position to within about 0.4 metres in the campus study. It does not give species, condition, structure or ULE. Those stay with the arborist. In a street the receiver will often hold a fix between buildings, so absolute positions are better than in a stand. Multipath off facades is the new failure mode. Check the cloud against the kerb line or a known feature before you trust it.
What the reviewer will check
Before a tree list goes to a yield analyst or a council, the checks are the same ones the studies ran. Is the ground model plausible across the whole plot, with no stems standing on a false floor? Does the flagged-stem count make sense for the stand, and has each flag been opened and either fixed or excluded with a note? Is the section height right for the standard in play, 1.3 or 1.4 metres? Is the plot area the area actually covered, so the per-hectare numbers are not scaled from a partial cover? Do the stem positions register onto last season's plot within the 0.2 to 0.3 metres the method allows? Is the height figure labelled as a scanner estimate where the canopy was closed? And is the georeferencing method written down, so the next crew knows whether the coordinates are absolute or relative to a peg?
Where we stand
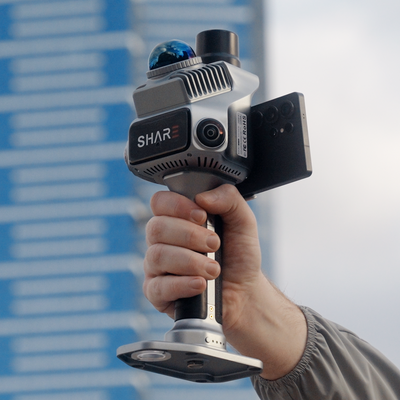
We sell and set up the SHARE C1, C1 Pro and C10 handheld scanners and we run 3DFin on the first plot. We have not published a plot study on those units. The figures above come from GeoSLAM, Hovermap and comparable sensors. A scanner of the same class should be expected to land in the same range until someone measures it.
If you have a plot cloud already, send us the LAS and we will run the tree list, tell you which stems were flagged and why, and send the sheet back with the ground model so you can see what it stood on.